Multi-instrument support
Ngscopeclient allows a single session to connect to arbitrarily many instruments simultaneously. These instruments can be fully independent of each other (triggering with no relationship to the others) or grouped into “trigger groups”, via a cross-trigger sync cable, allowing several instruments to trigger in lock-step.
Trigger groups
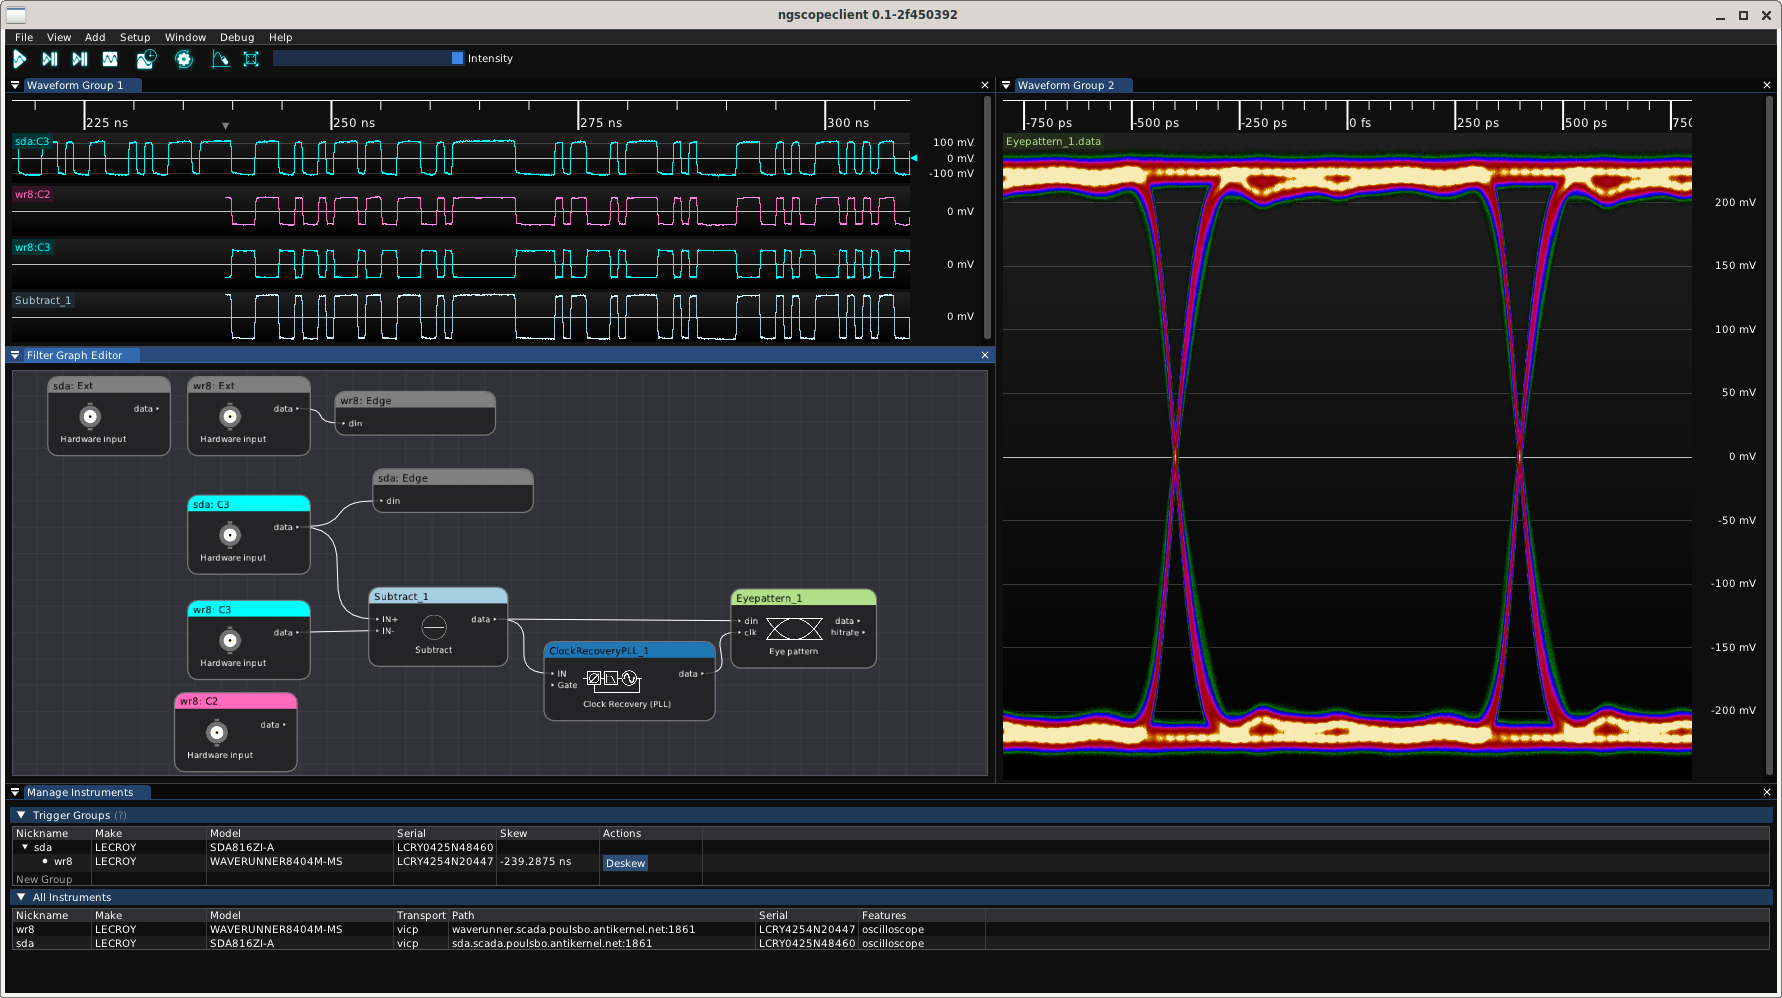
Any number of oscilloscopes, of any supported make or model, may be combined in the same trigger group. Sample rates need not be the same, and the horizontal positions of each instrument within a group may be adjusted independently. This allows complex analytical setups for study of behavior across varying time scales:
- Use a high speed oscilloscope to identify packets or signal integrity issues in a gigabit serial signal, then trigger a low-speed instrument recording tens or hundreds of ms of activity on status GPIOs, MDIO or I2C buses, etc. before and after the high speed events
- Combine multiple instruments to capture data on more channels than a single instrument can support
- Use two or more instruments to capture cause-and-effect pairs on different channels separated by arbitrarily long time periods, while displaying on a single timeline
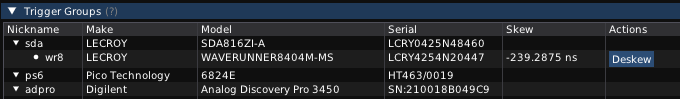
An automated deskew wizard allows the cross-trigger path delay within a trigger group to be measured and calibrated out, so that waveforms from all oscilloscopes in the group will line up correctly on the timeline. Simply connect a PRBS to one channel of each instrument and click the “deskew” button.
Protocol decodes, math functions, and filter blocks can work across inputs from multiple instruments. Most math functions require their inputs to be sampled at the same rate, so you may need to use a resampling block if the instruments are not configured identically. Most protocol decode blocks can work with inputs of different sample rates without issue as long as the deskew calibration has been performed.
Other instruments
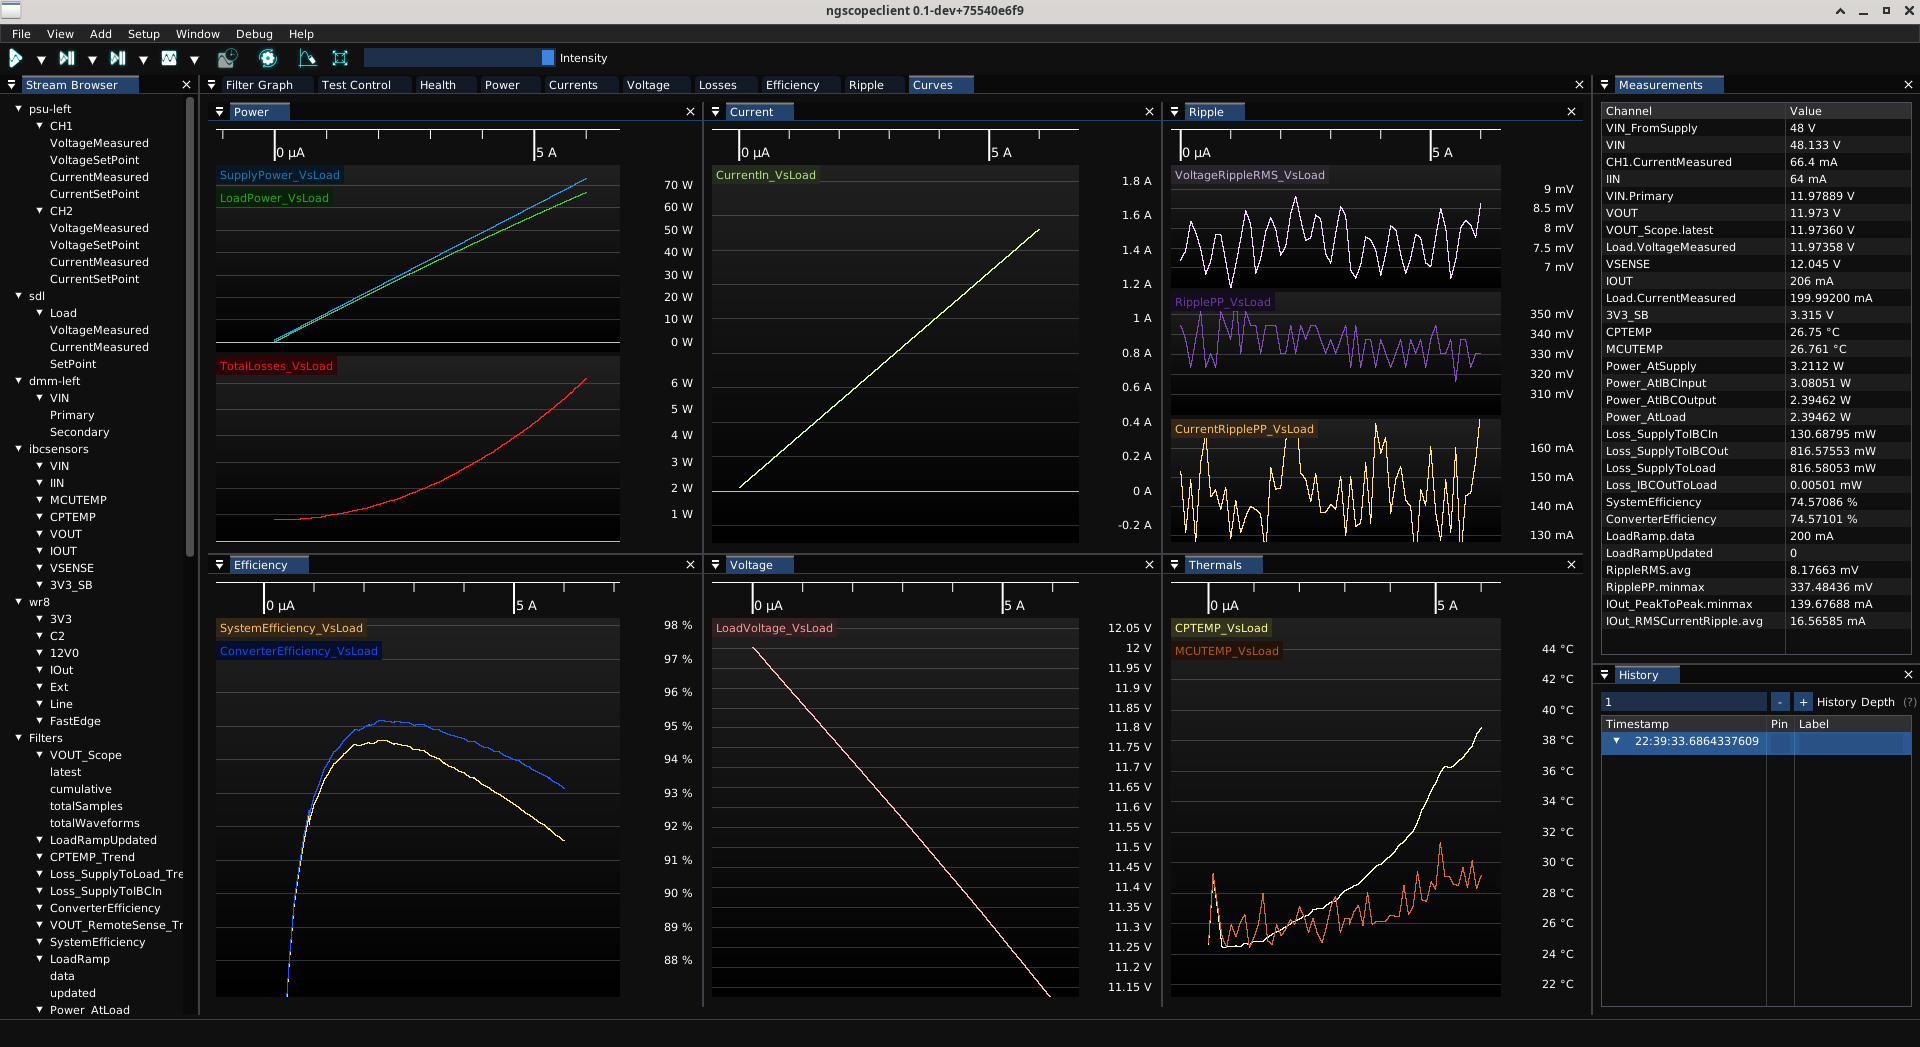
In addition to oscilloscopes, ngscopeclient can interface to power supplies, signal generators, active loads, and many other types of instrumentation. Integrating all of these instruments in a single user interface allows complex experiment control from one place, as well as performing data analysis across instrument.
For example, you can measure the voltage and current supplied to a DC-DC converter under test with a power supply, while simultaneously measuring voltage and current sunk by an active load, and output ripple with an oscilloscope.
You can even perform filter graph operations on data from different instruments, for example dividing the power sunk at the load by the power provided by the supply to calcualate efficiency of the converter, or graphing output ripple against load current.